

Microsoft earnings (NAS100:MSFT) are also released this week, after the company surged to a $4 trillion market valuation.
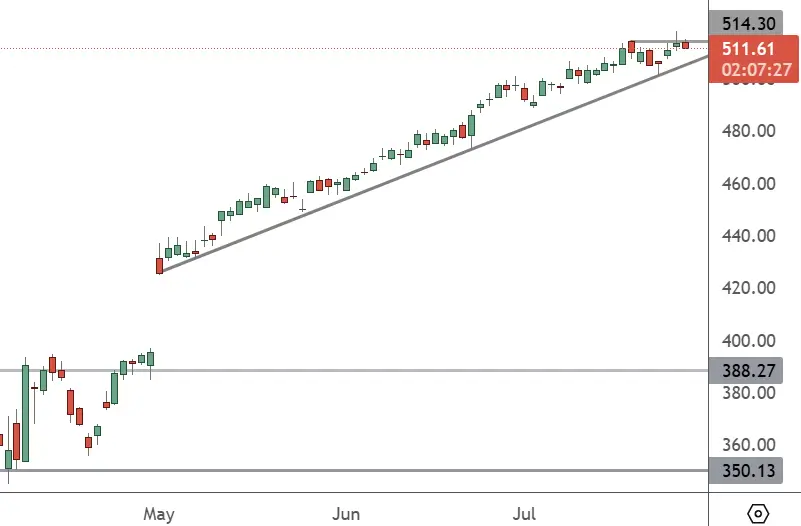
MSFT – Daily Chart
The price of MSFT has a potential double top in play with the hammer candlestick last week on the daily chart. U.S. tech stocks are rising on speculation, but they are considered risky at these levels.
Microsoft’s stock has surged by more than 30% from the April lows, and there is no room for weakness in the upcoming numbers. The company needs Azure sales to be strong, and there is hope after ServiceNow and Google Cloud both delivered strong numbers last week.
“We believe the combination of solid enterprise spending environment, continued improvements in go-to-market execution in the non-AI business, as well as healthy genAI demand that continues to outstrip supply, should enable Azure to post ~100-200 basis points of upside vs. management’s 34-35% year over year constant currency guidance,” said Stifel analyst Brad Reback.
The next focus for analysts in the coming report will be the company’s CAPEX plans after Alphabet lifted its own CAPEX plans by $10 billion last week. Companies are spending substantial sums of shareholder money to pursue their AI goals, but some are concerned about the return on investment.
“We expect Microsoft to remain aggressive on capex and expect cash capex growth in the 25% range next year. That said, we believe the aggregate rate of growth should normalize and be more in line with overall cloud growth,” said Evercore ISI analyst Kirk Materne.
The tech earnings season is arriving at a crucial time, as the stock market continues to climb to all-time highs, and there is a real risk of a correction if negative sentiment emerges. Any weakness in Microsoft’s earnings could be punished, and the chart setup does have potential for a correction to start.